
Student loan repayment: What should we expect?
Chief Economist Eugenio J. Alemán discusses current economic conditions.
We have heard lots of commentary on the student loan repayment issues facing almost 44.5 million Americans. Some of these commentaries are correct but there are others that miss the mark. Let’s try to clarify some of these issues in order to make sense of the potential severity of the issues confronting individuals who hold student loan debt as well as its potential impact on U.S. economic activity. In general, if the economy is growing and there is full employment, as it is today, there should not be an issue with student loan debt holders being able to afford their debt payments. There may be some exceptions with predatory student loan lending by private firms, but those cases are a minority of student loans.
The Trump administration postponed student loan debt repayment at the start of the COVID-19 pandemic and the postponement has been extended eight times since. Although there were very good reasons for the original postponement as well as for several of the extensions, those reasons cannot be considered necessary today. Furthermore, efforts have continued to improve the ability of individuals to pay student loan debts after the U.S. Supreme Court concluded that the Biden administration went too far in promising to forgive student debt loans. The Biden administration has proposed some income-based alternatives for student loan repayment that will benefit some borrowers, perhaps in the lower echelons of income, but student loan repayment is scheduled to start again in October 2023.
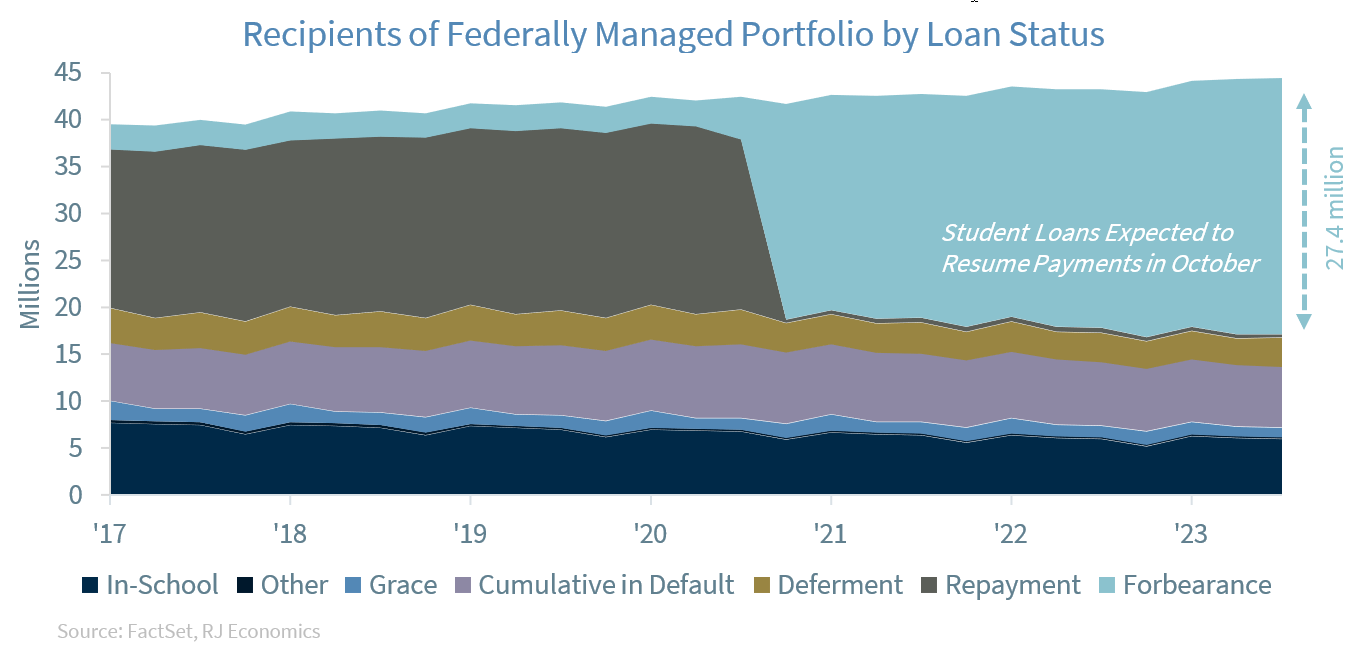
Although there were about 44.5 million individuals with student loan debt as of Q2 2023, ‘only’ about 27.4 million were in forbearance by the second quarter of 2023 while 6.5 million were ‘cumulative in default,’ which are loans that are more than 360 days delinquent. Six million students are still in school, so they do not have to start paying yet, 1 million are in the six-months grace period after leaving school and 300,000 individuals are still repaying their loans. Furthermore, 3.1 million individuals were in ‘deferment,’ which means that their payments have been temporarily suspended or “reduced as a result of certain types of financial hardships.” Finally, there are about 200,000 individuals marked as ‘other,’ which “includes loans that are in non-defaulted bankruptcy and in a disability status.” So, ‘only’ about 27.4 million student loans are expected to resume payments in October, not 44 million as some reports have indicated.
What about monthly payments of student loans?
Here is where the issue of student loans gets murky and tends to go down political/ideological rabbit holes. We will try to stay away from those rabbit holes and will rely on statistics from our previous research as well as other research we believe provides serious analysis on this topic. From the start, we want to clarify that the monthly payments we typically talk about are monthly payments on undergraduate college degree student loans and not graduate student loans. The biggest reason for this is that the annual limit on federal student loans for an undergraduate degree is $12,500 and up to, potentially, $57,500 in total while the annual limit for a graduate degree is $20,500 per year and up to $138,500 in total. This total would normally also include undergraduate student loans. For private student loans, while the limit may vary depending on the lender, students may be able to borrow without a limit.
On average, student loan monthly payments for undergraduate college degrees are in the vicinity of $200, with higher estimated payments if the student loan was for graduate studies or if it also included graduate studies.1 That is, not considering graduate student loan debt payments, the burden of undergraduate student loan payments is not so large, especially considering that individuals with college degrees typically earn more than individuals without a college degree. Of course, there is a group of students that may have gotten student loans but never graduated with a degree. The burden for those students may be a bit higher.
Not all debt is created equal
Let’s first start by clarifying something regarding student loan debt. It is no longer true that student loans cannot be discharged in bankruptcy court proceedings. It is true that it may be more difficult than discharging other types of debt in bankruptcy court, but there are procedures to discharge student loan debt in bankruptcy procedures, in contrast to the popular belief that it is not possible. 2
It is true that if you have an income and you don’t have to pay loans then you can spend that income on anything you want, but everybody faces a budget constraint. You can probably make that budget constraint less binding by borrowing today and paying over time, which is what individuals normally do, especially if interest rates are very low, as they have been during the last several decades. However, at some point in time, the ability to borrow to continue to push forward the day of reckoning has its limits.
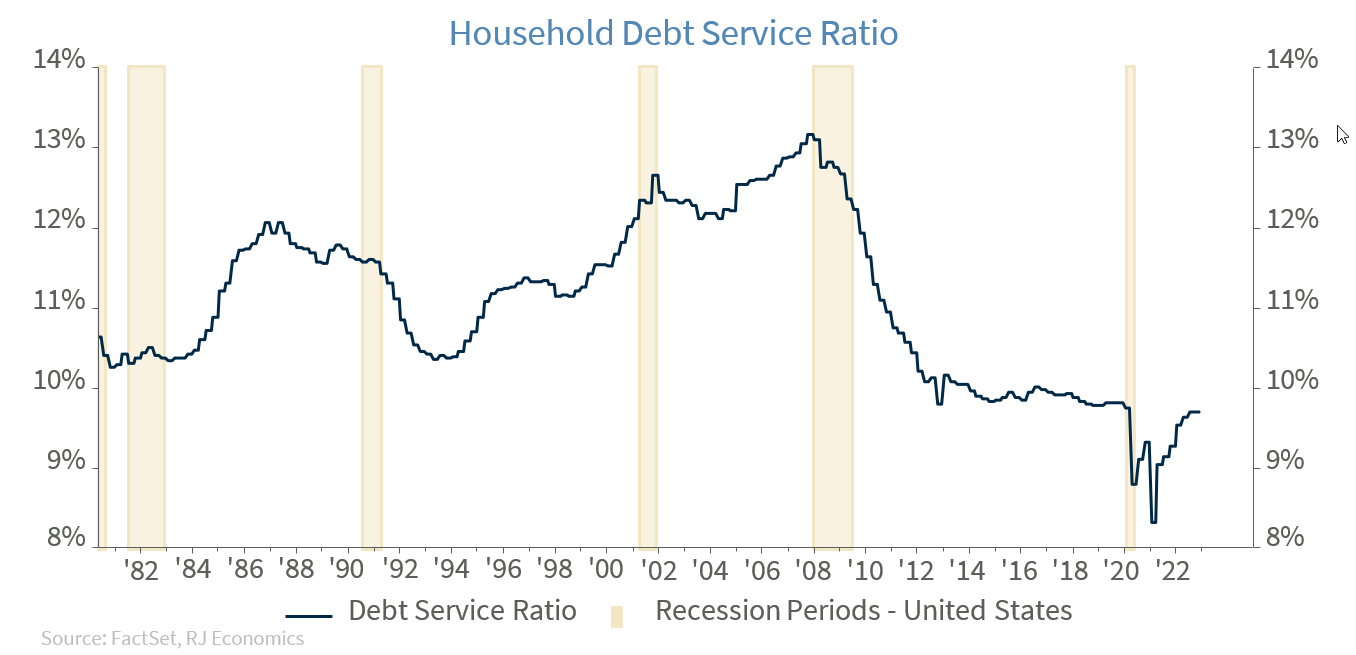
Thus, the truth is that Americans have debts, and they have to balance consumption with the payment of these debts. This is the case for automobile loan debts, home mortgage debts, student loan debts, consumer loans debt and/or credit card debts, etc. But if we look at households’ financial conditions today versus the recent past, it is clear that such conditions are much better today than what they were before the Great Recession, as the household debt service ratio graph on the prior page shows.
However, all debts are not created equal. Some debts are secured by assets while others are not. But not even all debts secured by assets have the same characteristics. Home mortgage debts are secured by the actual homes they are underwritten against and, typically, home prices go up. Of course, there are exceptions, like what happened during the Great Recession, but it is mostly true. Car loans are also secured by an asset, but once you take your car off the dealer’s property, your car’s value drops considerably. Thus, car loan debt, we can say, is partially secured.
On the other hand, consumer loan debt or credit card debts are typically not secured by assets, just by the individual’s incomes as well as the individual’s willingness to pay. This is the reason why these loans typically pay the highest interest rates in the market, as they signify higher risks for lenders.
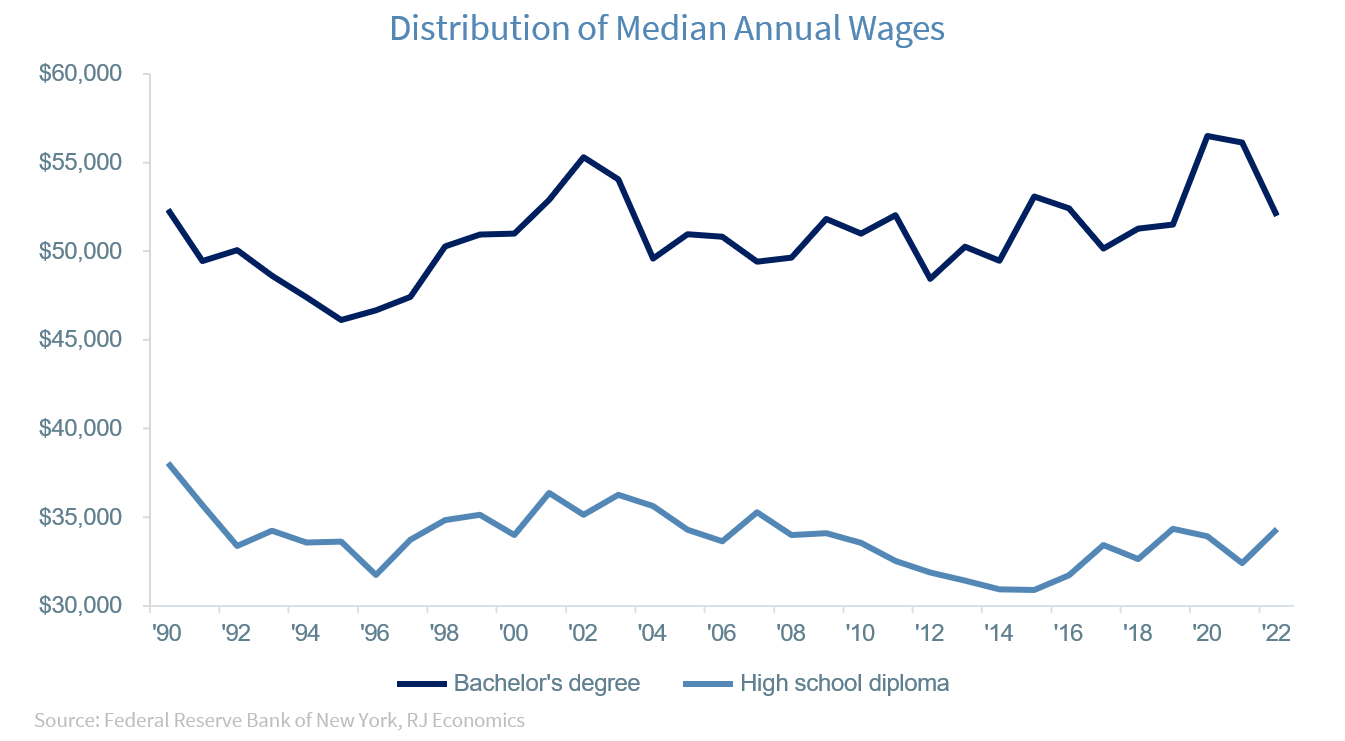
Student loan debt may be either secured or unsecured, depending on how we define an asset. Student loans are, in principle, unsecured debt. However, we may argue that if your preparation/knowledge acquired during your education gives you the opportunity to earn more over time, this means that your education is an investment, that is, you are investing in your earnings capacity over time. Thus, education should be considered an investment and, unless that investment gets compromised by a disability that reduces the individual’s ability to generate income in the future, it should be an investment that appreciates over time. In fact, one of the arguments made for getting a degree is that there is ample historical evidence that those with college degrees earn more during their life than those without college degree.
This is, perhaps, one possible explanation for why financial institutions typically issues credit cards to college students even if they don’t have an income stream while in college, while another explanation is that these students are also being supported by family members, i.e., parents, and sometimes require parents to co-sign such extension of credit.
Potential effects on economic activity
Once again, there are no good arguments today to keep postponing the start of the repayment of student loans as economic conditions have remained positive, especially because the rate of unemployment has remained at historically low levels since the end of the COVID-19 pandemic. This means that individuals who have student loans will have to add student loan payments to their regular scheduled monthly payments and thus, will have to give up consuming other goods instead. Typically, we would expect that those with student loans will have to give up some discretionary consumption in order to be able to pay back their student loans.
While some individuals may face difficulties adjusting consumption to be able to pay those loans, the overall effects on personal consumption expenditures and for the US economy should be relatively small. Our estimate below assumes the unlikely worst-case scenario where, despite the one-year leniency program, every one of the 27.4 million borrowers will start to repay their loans at $200/month, and the impact that this adjustment is going to have on personal consumption expenditures, and ultimately on GDP. Additionally, we created two other scenarios, where all borrowers pay $350 and $500 per month, and calculated the impact on GDP.
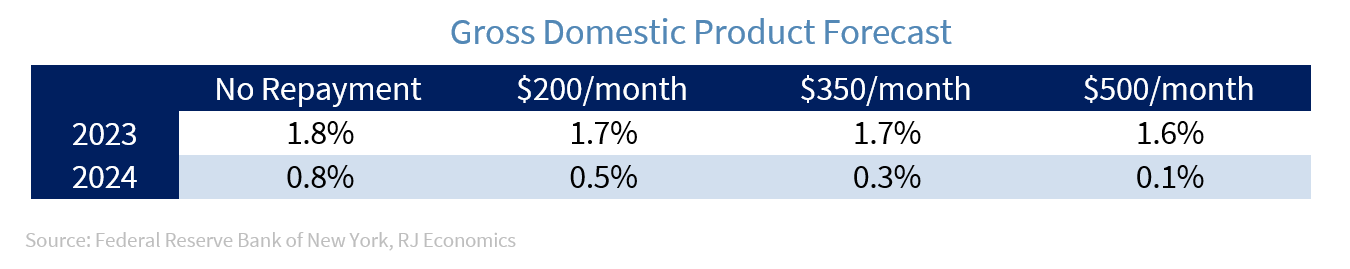
Our estimates show that even in the unlikely worst-case scenario, in which borrowers’ monthly payments are more than twice our base case estimate, and all borrowers start paying the full amount every month, the impact on GDP would be a reduction in GDP growth of 0.2 percentage points in 2023, and 0.6 percentage points in 2024. Our base case scenario is that not everyone will start repaying their loans in October, taking advantage of the one-year leniency program. Furthermore, for those who will start repaying immediately, the impact on GDP growth will likely be very light in 2023, and slightly higher in 2024 (~$60 billion). The bottom line is that we do not think that the restart of student loan repayments will have a severe impact on economic growth. Furthermore, as long as the labor market remains strong, there are alternatives (second job, gig economy, etc.) for individuals to complement their income and keep consumption going.
Economic and market conditions are subject to change.
Opinions are those of Investment Strategy and not necessarily those of Raymond James and are subject to change without notice. The information has been obtained from sources considered to be reliable, but we do not guarantee that the foregoing material is accurate or complete. There is no assurance any of the trends mentioned will continue or forecasts will occur. Last performance may not be indicative of future results.
Consumer Price Index is a measure of inflation compiled by the US Bureau of Labor Statistics. Currencies investing is generally considered speculative because of the significant potential for investment loss. Their markets are likely to be volatile and there may be sharp price fluctuations even during periods when prices overall are rising.
Consumer Sentiment is a consumer confidence index published monthly by the University of Michigan. The index is normalized to have a value of 100 in the first quarter of 1966. Each month at least 500 telephone interviews are conducted of a contiguous United States sample.
Personal Consumption Expenditures Price Index (PCE): The PCE is a measure of the prices that people living in the United States, or those buying on their behalf, pay for goods and services. The change in the PCE price index is known for capturing inflation (or deflation) across a wide range of consumer expenses and reflecting changes in consumer behavior.
The Consumer Confidence Index (CCI) is a survey, administered by The Conference Board, that measures how optimistic or pessimistic consumers are regarding their expected financial situation. A value above 100 signals a boost in the consumers’ confidence towards the future economic situation, as a consequence of which they are less prone to save, and more inclined to consume. The opposite applies to values under 100.
Certified Financial Planner Board of Standards Inc. owns the certification marks CFP®, CERTIFIED FINANCIAL PLANNER™, CFP® (with plaque design) and CFP® (with flame design) in the U.S., which it awards to individuals who successfully complete CFP Board's initial and ongoing certification requirements.
Links are being provided for information purposes only. Raymond James is not affiliated with and does not endorse, authorize or sponsor any of the listed websites or their respective sponsors. Raymond James is not responsible for the content of any website or the collection or use of information regarding any website's users and/or members.
GDP Price Index: A measure of inflation in the prices of goods and services produced in the United States. The gross domestic product price index includes the prices of U.S. goods and services exported to other countries. The prices that Americans pay for imports aren't part of this index.
The Conference Board Leading Economic Index: Intended to forecast future economic activity, it is calculated from the values of ten key variables.
The Conference Board Coincident Economic Index: An index published by the Conference Board that provides a broad-based measurement of current economic conditions.
The Conference Board lagging Economic Index: an index published monthly by the Conference Board, used to confirm and assess the direction of the economy's movements over recent months.
The U.S. Dollar Index is an index of the value of the United States dollar relative to a basket of foreign currencies, often referred to as a basket of U.S. trade partners' currencies. The Index goes up when the U.S. dollar gains "strength" when compared to other currencies.
The FHFA House Price Index (FHFA HPI®) is a comprehensive collection of public, freely available house price indexes that measure changes in single-family home values based on data from all 50 states and over 400 American cities that extend back to the mid-1970s.
Import Price Index: The import price index measure price changes in goods or services purchased from abroad by U.S. residents (imports) and sold to foreign buyers (exports). The indexes are updated once a month by the Bureau of Labor Statistics (BLS) International Price Program (IPP).
ISM New Orders Index: ISM New Order Index shows the number of new orders from customers of manufacturing firms reported by survey respondents compared to the previous month. ISM Employment Index: The ISM Manufacturing Employment Index is a component of the Manufacturing Purchasing Managers Index and reflects employment changes from industrial companies.
ISM Inventories Index: The ISM manufacturing index is a composite index that gives equal weighting to new orders, production, employment, supplier deliveries, and inventories.
ISM Production Index: The ISM manufacturing index or PMI measures the change in production levels across the U.S. economy from month to month.
ISM Services PMI Index: The Institute of Supply Management (ISM) Non-Manufacturing Purchasing Managers' Index (PMI) (also known as the ISM Services PMI) report on Business, a composite index is calculated as an indicator of the overall economic condition for the non-manufacturing sector.
Consumer Price Index (CPI) A consumer price index is a price index, the price of a weighted average market basket of consumer goods and services purchased by households. Changes in measured CPI track changes in prices over time.
Producer Price Index: A producer price index (PPI) is a price index that measures the average changes in prices received by domestic producers for their output.
Industrial production: Industrial production is a measure of output of the industrial sector of the economy. The industrial sector includes manufacturing, mining, and utilities. Although these sectors contribute only a small portion of gross domestic product, they are highly sensitive to interest rates and consumer demand.
The NAHB/Wells Fargo Housing Opportunity Index (HOI) for a given area is defined as the share of homes sold in that area that would have been affordable to a family earning the local median income, based on standard mortgage underwriting criteria.
The S&P CoreLogic Case-Shiller U.S. National Home Price NSA Index measures the change in the value of the U.S. residential housing market by tracking the purchase prices of single-family homes.
The S&P CoreLogic Case-Shiller 20-City Composite Home Price NSA Index seeks to measures the value of residential real estate in 20 major U.S. metropolitan.
Source: FactSet, data as of 7/7/2023