
The federal funds rate: Back to the drawing board
Chief Economist Eugenio J. Alemán discusses current economic conditions.
We have been saying, for many months now, that the more markets try to second guess the Federal Reserve (Fed) and push longer-term interest rates down, the higher would be the probability that the Fed would continue to increase the federal funds rate.
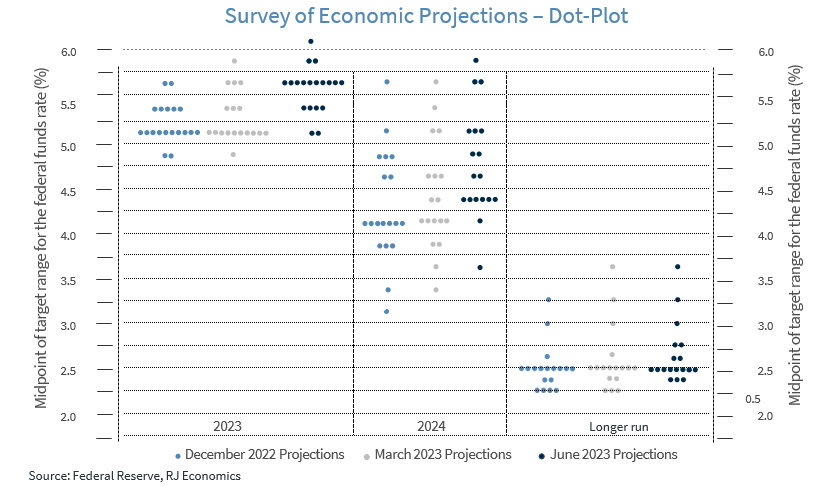
What happened with the release of the Survey of Economic Projections (SEP) was just that. Since the Fed has not been able to convince markets that longer-term interest rates need to be higher – and for longer – the only recourse the Fed has is to increase the only interest rate it controls, the federal funds rate, in order to push longer-term interest rates higher. However, after more than a year and a cumulative 500 basis point increase, markets continue to speculate that the Fed is going to pivot very soon, and this has pushed longer-term interest rates lower, as was the case during the first quarter of the year.
We have covered this topic before. Here is what we wrote on March 3, 2023 in our Thoughts Of The Week: “The question today, and for the last year, has been how high the Fed is going to go. However, what markets seem to not understand is that the answer is in the hands of the market, not the Fed. The more markets try to push long-term interest rates down, the more the Fed will tighten monetary policy, period.”
We further said: “You would probably ask why? Because the Fed has control over only one rate of interest, the federal funds rate. All the other interest rates are determined by market forces. The Fed can try to ‘guide’ the markets to what it wants them to see, but markets are, many times, stubborn, and don’t want to believe what the Fed is trying to convey. This is one of those times.”
Markets should take the new ‘dot plot’ and the SEP as instruments of monetary policy and not discount the information it brings. These instruments are part of what the Fed calls ‘guidance’ and guiding is what it is doing even though it decided to pause during the Federal Open Market Committee meeting.
We now believe that the Fed is going to go one more time and increase the federal funds rate by 25 basis points. However, we are still not convinced that they will do so in July, as markets seem to think today. We think they may go higher in September or October/November and keep the ‘powder dry’ just in case they have to move higher in December. Thus, at this time, we think the terminal rate will be 5.50% instead of 5.75% but it will all depend on how inflation and other economic data continues to evolve during the second half of the year.
Furthermore, it is clear that during its more than year long interest rate campaign, the Fed meant it when it said “higher interest rates for longer” because current policy plus the ‘dot plot’ precludes it from bringing interest rates down during 2023, which has been the mantra for markets. Hopefully, markets will finally get the message and act accordingly, keeping expectations for a pivot tucked away for 2024. At the same time, although the Fed has a potential second 25 basis point increase later in the year, we think it will not need to go there because inflation will continue to come down and there will be no need to press the brakes further.
Inflation and retail and food services sales
Although markets were happy this week with the results from both the Consumer Price Index (CPI), and the Producer Price Index (PPI) reports, it is clear that the Fed is looking past those numbers and concentrating more on core prices and especially on what it calls ‘supercore’ services, which is core services excluding housing. Furthermore, the headline CPI came down considerably on a year-over-year basis because of base effects as well as lower gasoline prices. However, as we said in our indicator report, the Fed cannot rely on gasoline prices, which are incredibly volatile and untrustworthy, to determine what it is going to do going forward. Furthermore, gasoline prices tend to have an outsized effect on consumer inflation expectations, so it has to feel comfortable that even if gasoline prices increase, core prices continue their disinflationary path. And the Fed is not there yet. Although it knows that shelter costs are going to start disinflating shortly, it needs to see ‘supercore’ services prices decline convincingly for it to be confidant inflation does not resume its uptrend. This means that it needs to keep interest higher for longer in order to continue to bring inflation down to the long-term target of 2.0%.

Furthermore, the retail and food services report this week showed that the American consumer is still engaging in the economy, with the potential for keeping inflation from coming down as the Fed is expecting. Thus, the Fed not only needs to buy some time for the cumulative 500 basis points increase in the federal funds rate to do the job, but also be ready to pull the trigger if what it has done so far is not enough.
The Fed Chairman was very clear during the conference call after the Federal Open Market Committee meeting that it continues to target a 2.0% for the PCE deflator and it will conduct monetary policy to achieve this target. And we should believe what Fed Chair Jerome Powell says.
Economic and market conditions are subject to change.
Opinions are those of Investment Strategy and not necessarily those of Raymond James and are subject to change without notice. The information has been obtained from sources considered to be reliable, but we do not guarantee that the foregoing material is accurate or complete. There is no assurance any of the trends mentioned will continue or forecasts will occur. Last performance may not be indicative of future results.
Consumer Price Index is a measure of inflation compiled by the US Bureau of Labor Statistics. Currencies investing is generally considered speculative because of the significant potential for investment loss. Their markets are likely to be volatile and there may be sharp price fluctuations even during periods when prices overall are rising.
Consumer Sentiment is a consumer confidence index published monthly by the University of Michigan. The index is normalized to have a value of 100 in the first quarter of 1966. Each month at least 500 telephone interviews are conducted of a contiguous United States sample.
Personal Consumption Expenditures Price Index (PCE): The PCE is a measure of the prices that people living in the United States, or those buying on their behalf, pay for goods and services. The change in the PCE price index is known for capturing inflation (or deflation) across a wide range of consumer expenses and reflecting changes in consumer behavior.
The Consumer Confidence Index (CCI) is a survey, administered by The Conference Board, that measures how optimistic or pessimistic consumers are regarding their expected financial situation. A value above 100 signals a boost in the consumers’ confidence towards the future economic situation, as a consequence of which they are less prone to save, and more inclined to consume. The opposite applies to values under 100.
Certified Financial Planner Board of Standards Inc. owns the certification marks CFP®, CERTIFIED FINANCIAL PLANNER™, CFP® (with plaque design) and CFP® (with flame design) in the U.S., which it awards to individuals who successfully complete CFP Board's initial and ongoing certification requirements.
Links are being provided for information purposes only. Raymond James is not affiliated with and does not endorse, authorize or sponsor any of the listed websites or their respective sponsors. Raymond James is not responsible for the content of any website or the collection or use of information regarding any website's users and/or members.
GDP Price Index: A measure of inflation in the prices of goods and services produced in the United States. The gross domestic product price index includes the prices of U.S. goods and services exported to other countries. The prices that Americans pay for imports aren't part of this index.
The Conference Board Leading Economic Index: Intended to forecast future economic activity, it is calculated from the values of ten key variables.
The Conference Board Coincident Economic Index: An index published by the Conference Board that provides a broad-based measurement of current economic conditions.
The Conference Board lagging Economic Index: an index published monthly by the Conference Board, used to confirm and assess the direction of the economy's movements over recent months.
The U.S. Dollar Index is an index of the value of the United States dollar relative to a basket of foreign currencies, often referred to as a basket of U.S. trade partners' currencies. The Index goes up when the U.S. dollar gains "strength" when compared to other currencies.
The FHFA House Price Index (FHFA HPI®) is a comprehensive collection of public, freely available house price indexes that measure changes in single-family home values based on data from all 50 states and over 400 American cities that extend back to the mid-1970s.
Import Price Index: The import price index measure price changes in goods or services purchased from abroad by U.S. residents (imports) and sold to foreign buyers (exports). The indexes are updated once a month by the Bureau of Labor Statistics (BLS) International Price Program (IPP).
ISM New Orders Index: ISM New Order Index shows the number of new orders from customers of manufacturing firms reported by survey respondents compared to the previous month. ISM Employment Index: The ISM Manufacturing Employment Index is a component of the Manufacturing Purchasing Managers Index and reflects employment changes from industrial companies.
ISM Inventories Index: The ISM manufacturing index is a composite index that gives equal weighting to new orders, production, employment, supplier deliveries, and inventories.
ISM Production Index: The ISM manufacturing index or PMI measures the change in production levels across the U.S. economy from month to month.
ISM Services PMI Index: The Institute of Supply Management (ISM) Non-Manufacturing Purchasing Managers' Index (PMI) (also known as the ISM Services PMI) report on Business, a composite index is calculated as an indicator of the overall economic condition for the non-manufacturing sector.
Consumer Price Index (CPI) A consumer price index is a price index, the price of a weighted average market basket of consumer goods and services purchased by households. Changes in measured CPI track changes in prices over time.
Producer Price Index: A producer price index (PPI) is a price index that measures the average changes in prices received by domestic producers for their output.
Industrial production: Industrial production is a measure of output of the industrial sector of the economy. The industrial sector includes manufacturing, mining, and utilities. Although these sectors contribute only a small portion of gross domestic product, they are highly sensitive to interest rates and consumer demand.
The NAHB/Wells Fargo Housing Opportunity Index (HOI) for a given area is defined as the share of homes sold in that area that would have been affordable to a family earning the local median income, based on standard mortgage underwriting criteria.
The S&P CoreLogic Case-Shiller U.S. National Home Price NSA Index measures the change in the value of the U.S. residential housing market by tracking the purchase prices of single-family homes.
The S&P CoreLogic Case-Shiller 20-City Composite Home Price NSA Index seeks to measures the value of residential real estate in 20 major U.S. metropolitan.
Source: FactSet, data as of 5/26/2023